
Hi, I’m Max
Principal Cloud Security Architect
CNCF Ambassador | Microsoft MVP Azure & Cloud Security
Latest Articles
Thoughts, tutorials, and insights on Cloud Native Security.
-

· 5 min read
KubeCon + CloudNativeCon Europe 2026: Reflections from the Field
Read more →: KubeCon + CloudNativeCon Europe 2026: Reflections from the FieldKubeCon + CloudNativeCon Europe is always a highlight of the year for anyone working in cloud native. This edition in Europe was no exception—intense, inspiring,…
-

· 5 min read
What Speaking at Cloud Native Rejekts Europe 2026 Taught Me
Read more →: What Speaking at Cloud Native Rejekts Europe 2026 Taught MeSpeaking at Cloud Native Rejekts Europe 2026 in Amsterdam was not just another conference stop for me it was a very different kind of experience.…
-

· 5 min read
Behind the CFPs: My Experience as an Open Source SecurityCon Reviewer for KubeCon Europe 2026
Read more →: Behind the CFPs: My Experience as an Open Source SecurityCon Reviewer for KubeCon Europe 2026This year, I had the privilege of serving as a reviewer for Open Source SecurityCon at KubeCon + CloudNativeCon Europe 2026 an experience that was…
-
· 5 min read
My First KubeCon as a CNCF Ambassador: Atlanta 2025 Highlights
Read more →: My First KubeCon as a CNCF Ambassador: Atlanta 2025 HighlightsThis year’s KubeCon in Atlanta brought together some of the most vibrant and forward-looking voices in the cloud-native ecosystem. Following an insightful and energetic Cloud…
-
· 5 min read
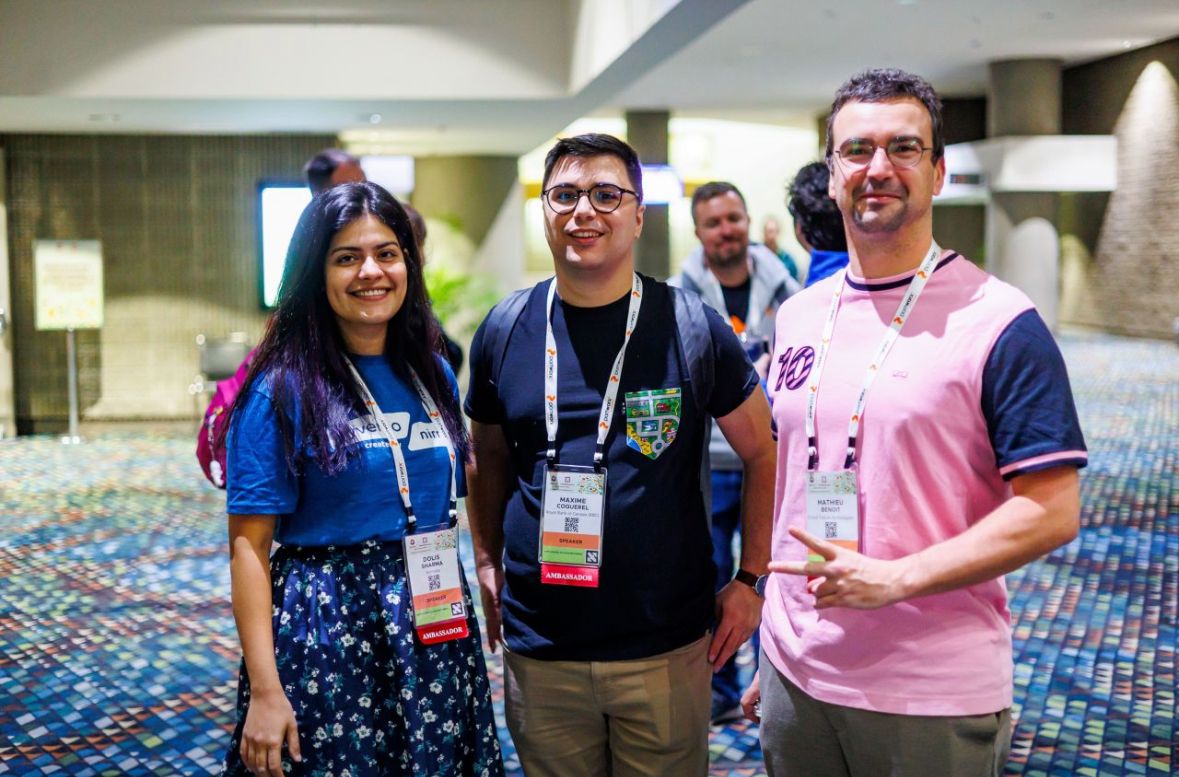
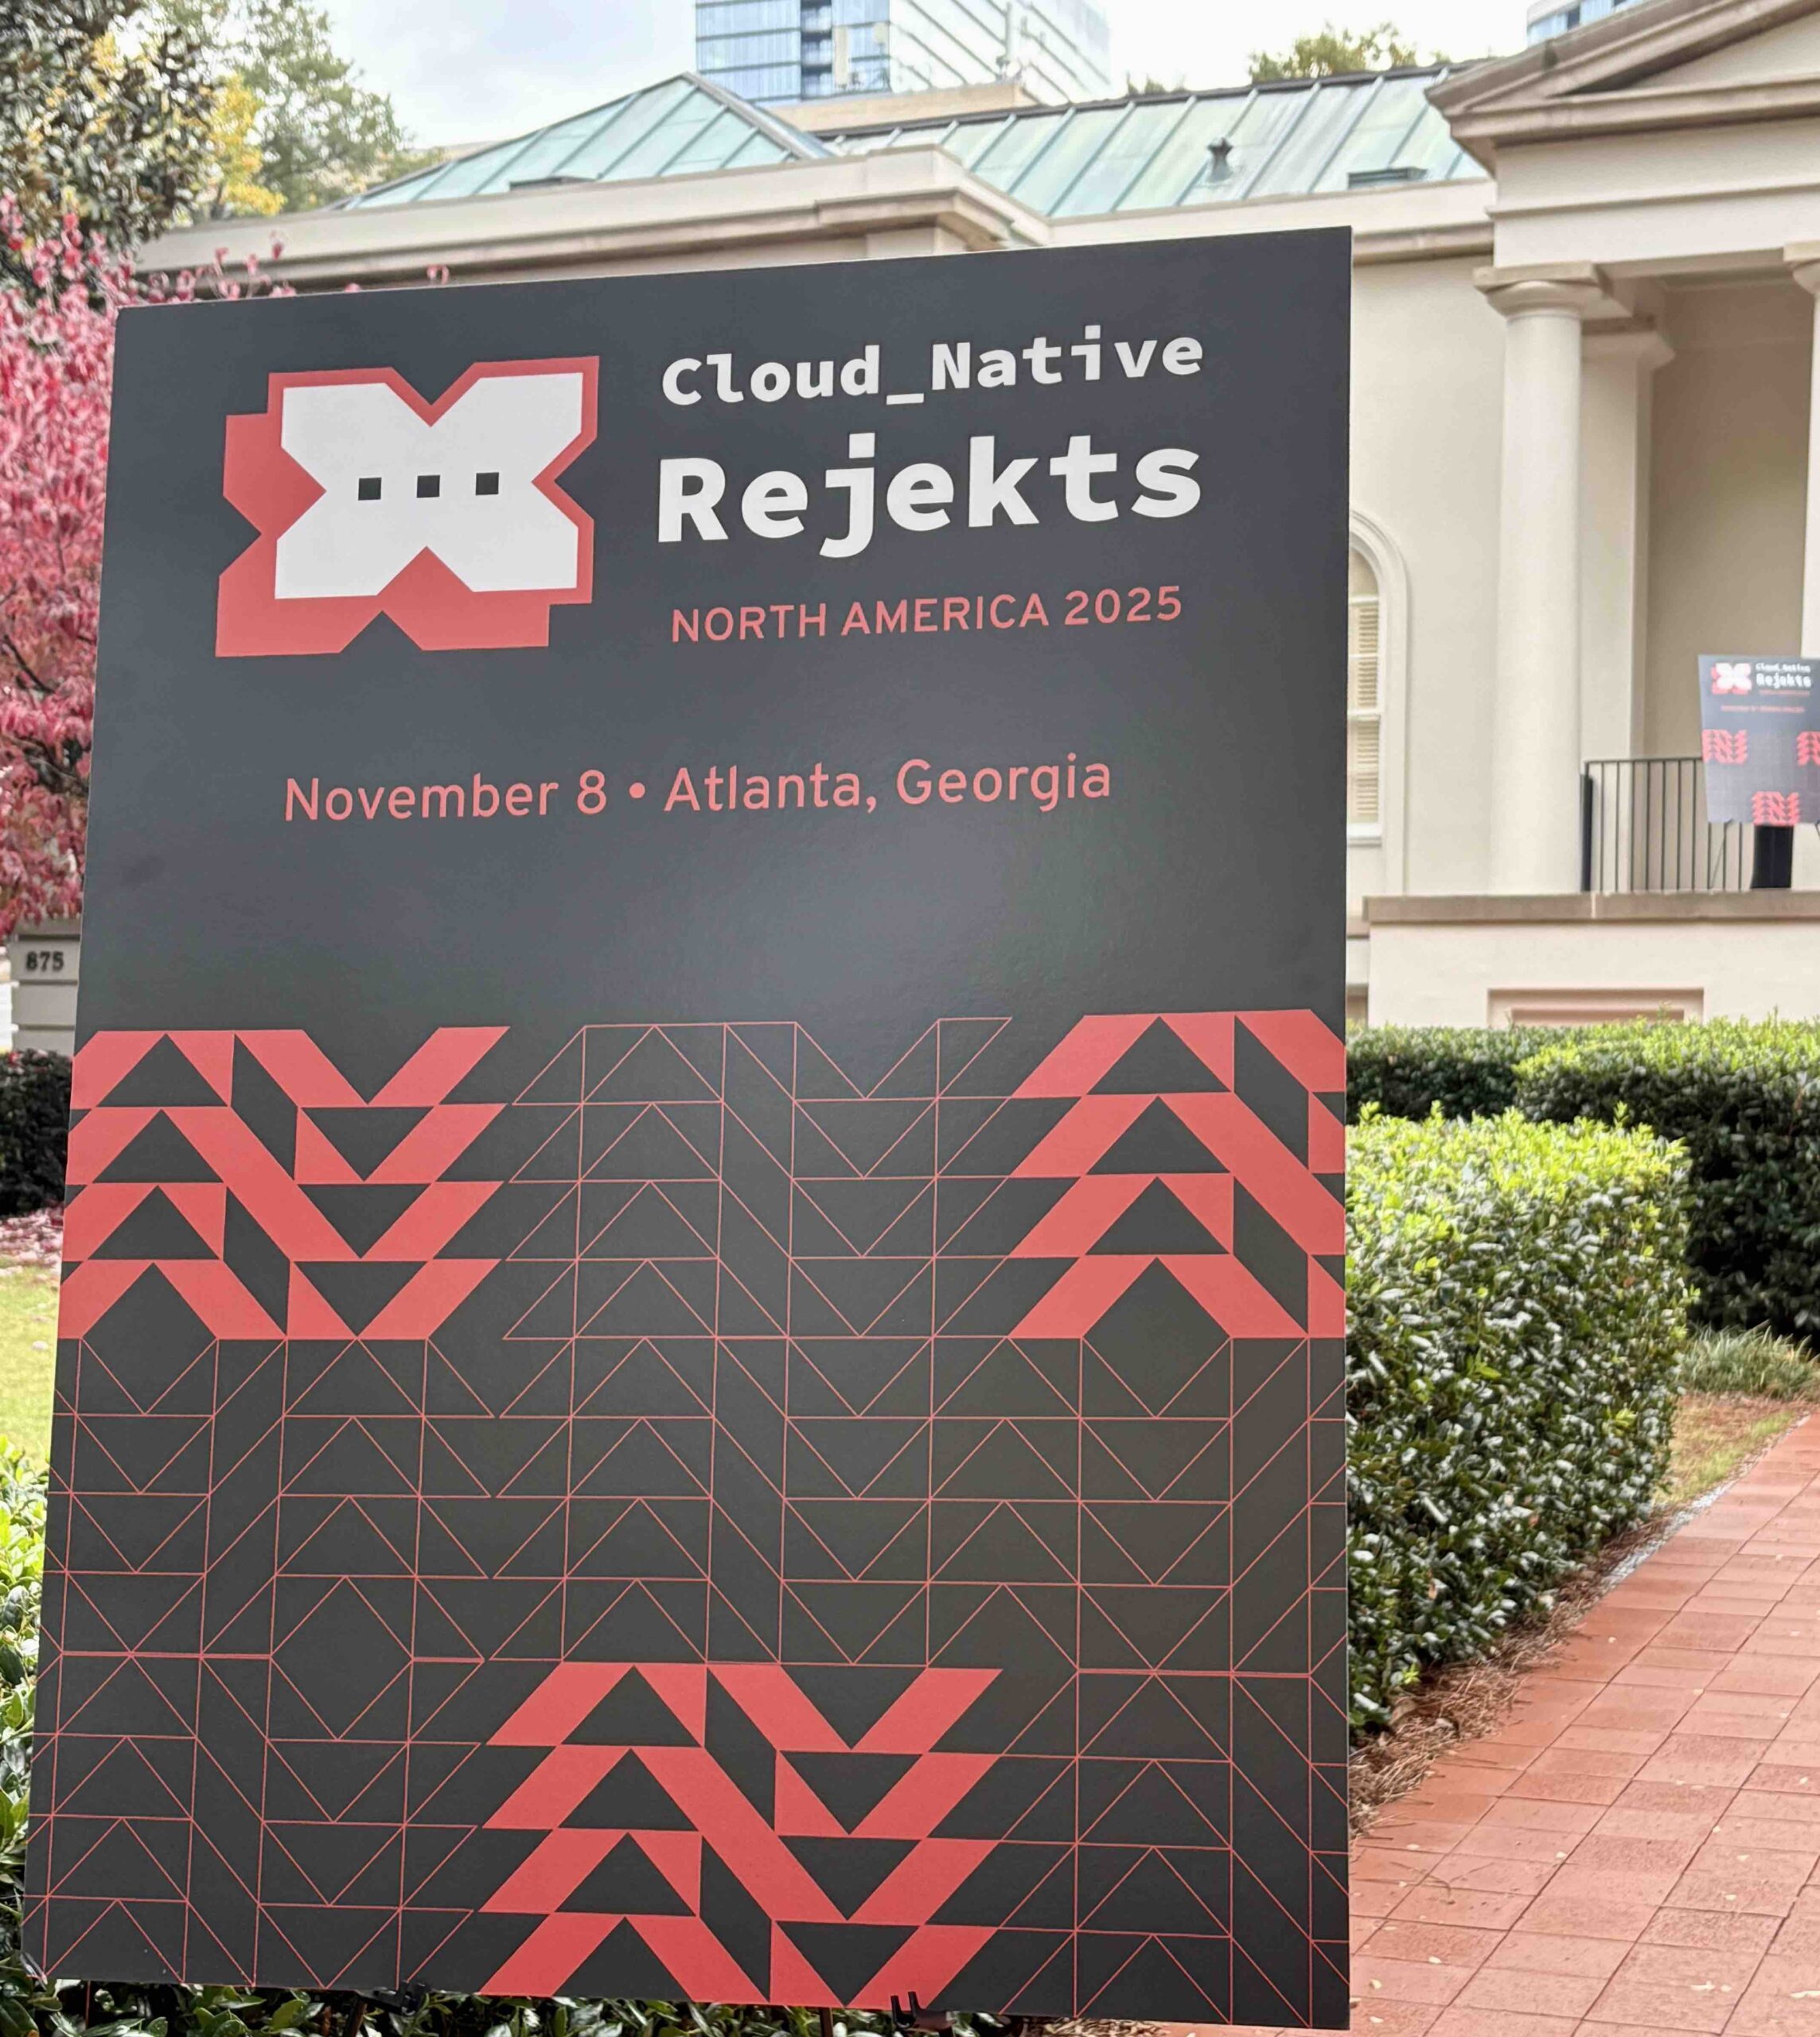
My Experience at Cloud Native Rejekts NA 2025
Read more →: My Experience at Cloud Native Rejekts NA 2025After speaking last year at Cloud Native Rejekts Salt Lake City 2024 with Mathieu on “Platform Engineering Loves Security: Shift Down to Your Platform, not Left to Your…
-
· 5 min read
Restricting Pod Access to Azure IMDS (Preview)
Read more →: Restricting Pod Access to Azure IMDS (Preview)In the world of Kubernetes on Azure, there’s been a longstanding default: any pod in your AKS cluster can query the Azure Instance Metadata Service (IMDS).…