Hi,
In this article, I will show you how you can configure a Prometheus and Grafana solution to monitor your OPA Gatekeeper policies. The requirement is to have an existing Prometheus and Grafana stack deployed. If you don’t have an OPA Gatekeeper deployed in your AKS cluster, please follow the step of this article.
By default, when you deploy OPA Gatekeeper inside your kubernetes cluster, some OPA Gatekeeper metrics are already exposed for you! The idea is to consume these metrics via Prometheus and use Grafana to create a dashboard. In this example, we will create a new Grafana Dashboard to expose the number of violation of our dry-run OPA policies.
We will use the prometheus scrape feature to collect the OPA metrics. I will recommend you to edit the configuration of the OPA gatekeeper audit pod and add these following configuration lines:
- prometheus.io/scrape: “true”
- prometheus.io/port: “8888”
➜  ~ kubectl get pods --namespace gatekeeper-system
 NAME                                             READY   STATUS    RESTARTS   AGE
 gatekeeper-audit-576f6d6f8d-p5nvk                1/1     Running   0          18h
 gatekeeper-controller-manager-85d8bf48c9-5j2f5   1/1     Running   0          6d
 gatekeeper-controller-manager-85d8bf48c9-v2d92   1/1     Running   1          6d1h
 gatekeeper-controller-manager-85d8bf48c9-z924v   1/1     Running   0          18h
 gatekeeper-policy-manager-5bf4586996-2cmw9       1/1     Running   0          18h

➜  ~ kubectl edit pods gatekeeper-audit-576f6d6f8d-p5nvk --namespace gatekeeper-system
apiVersion: v1
 kind: Pod
 metadata:
   annotations:
     container.seccomp.security.alpha.kubernetes.io/manager: runtime/default
     prometheus.io/scrape: "true"
     prometheus.io/port: "8888"
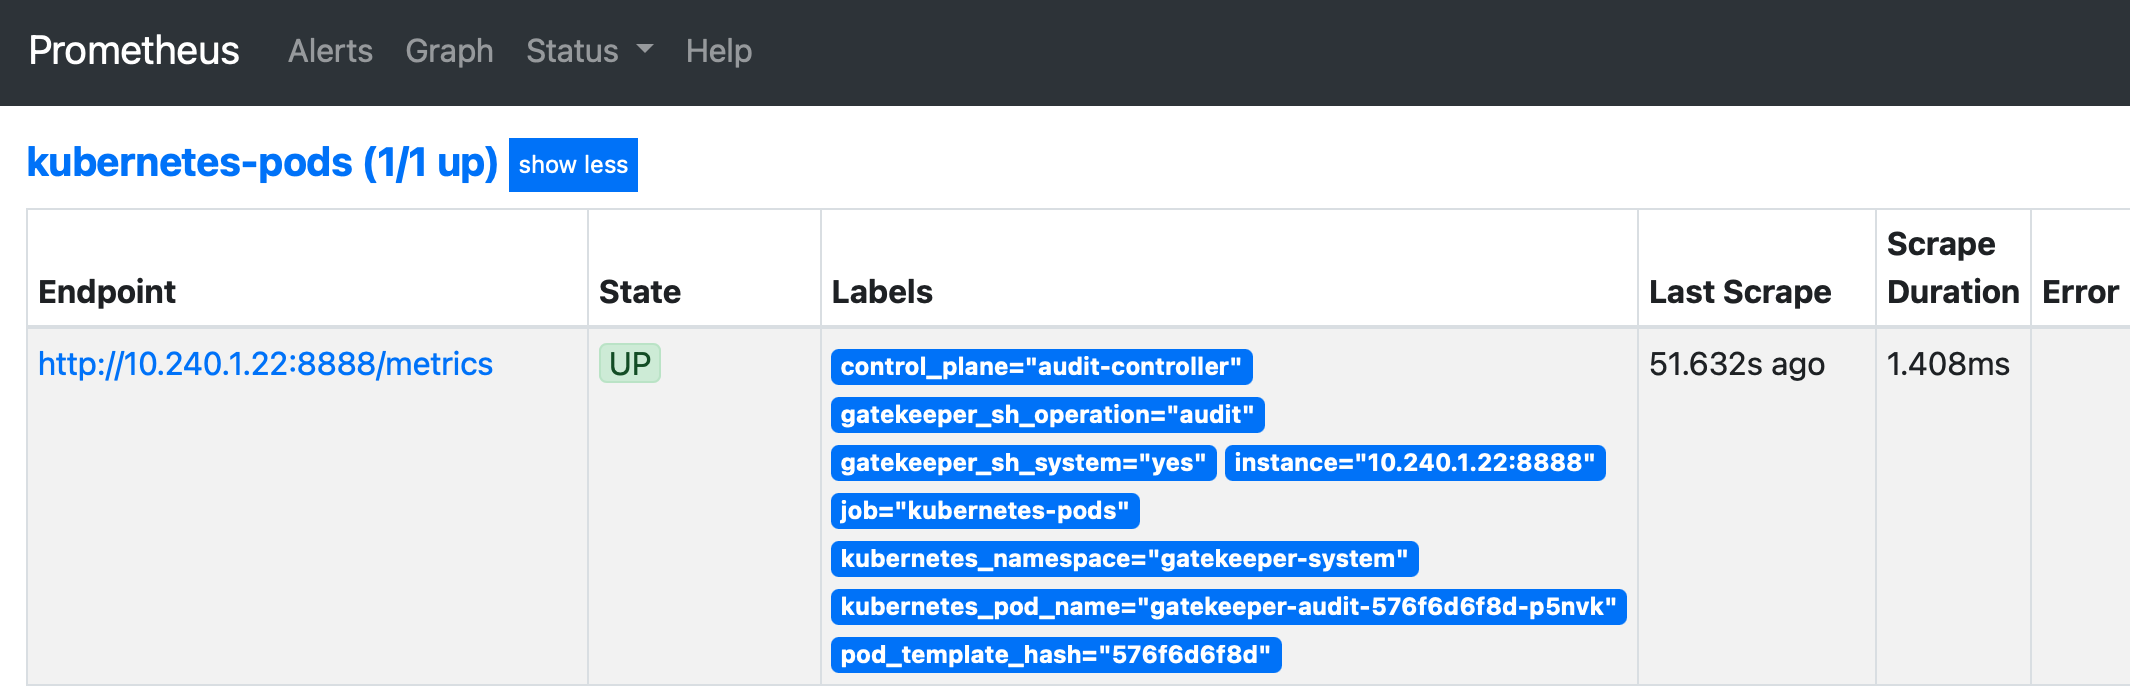
When it’s done, we can see in the prometheus target a new resource:
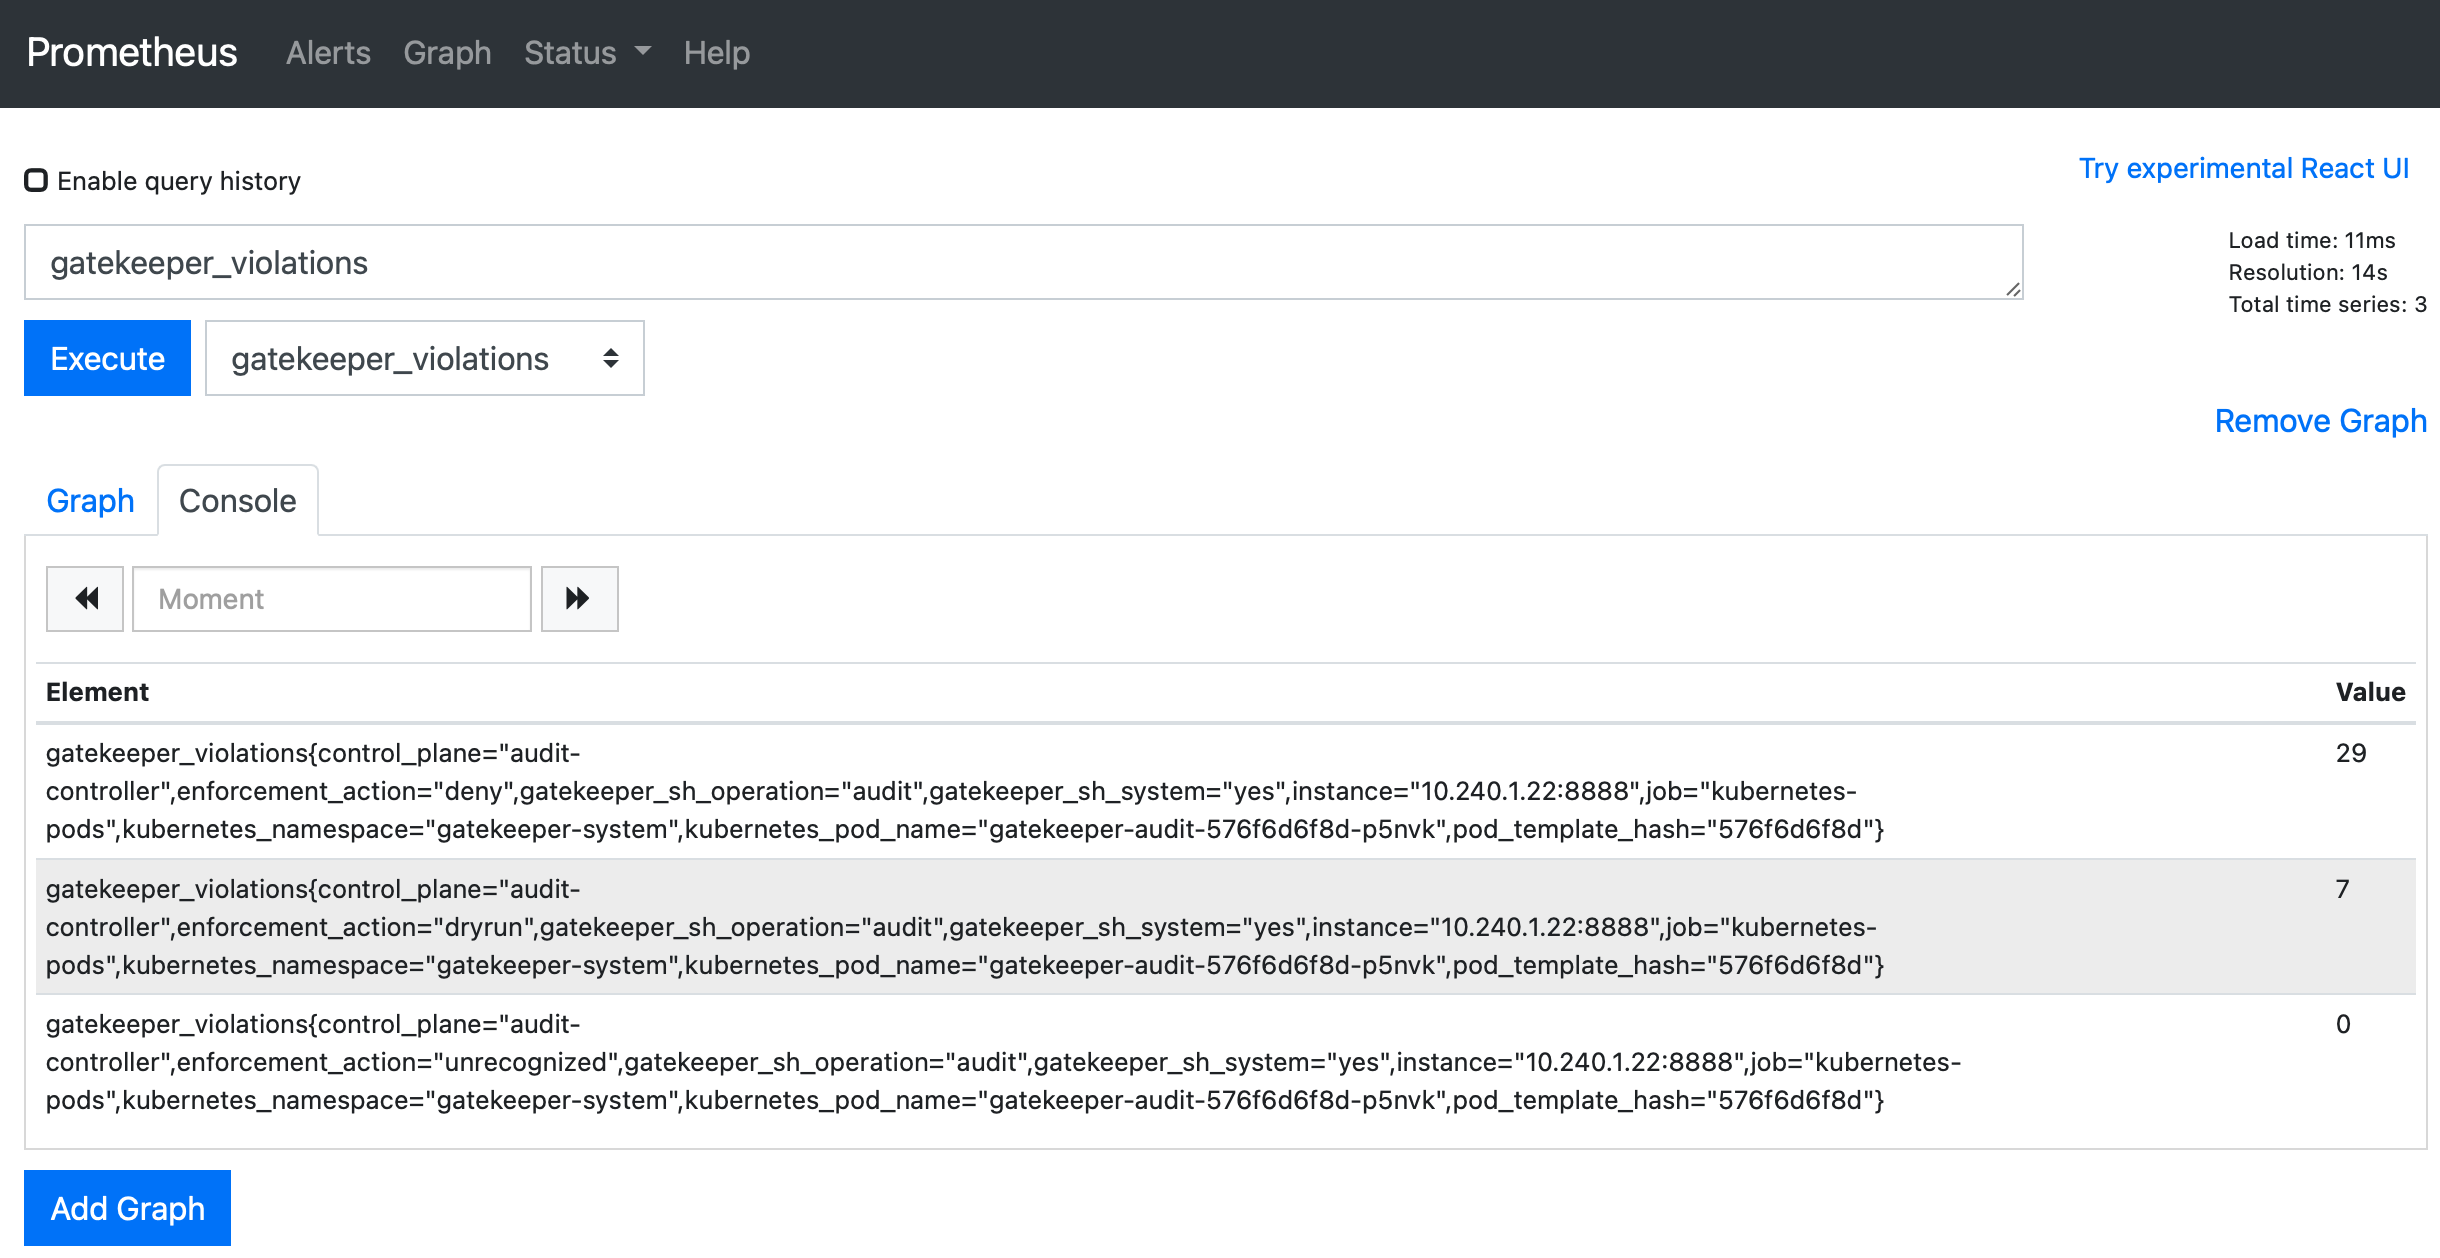
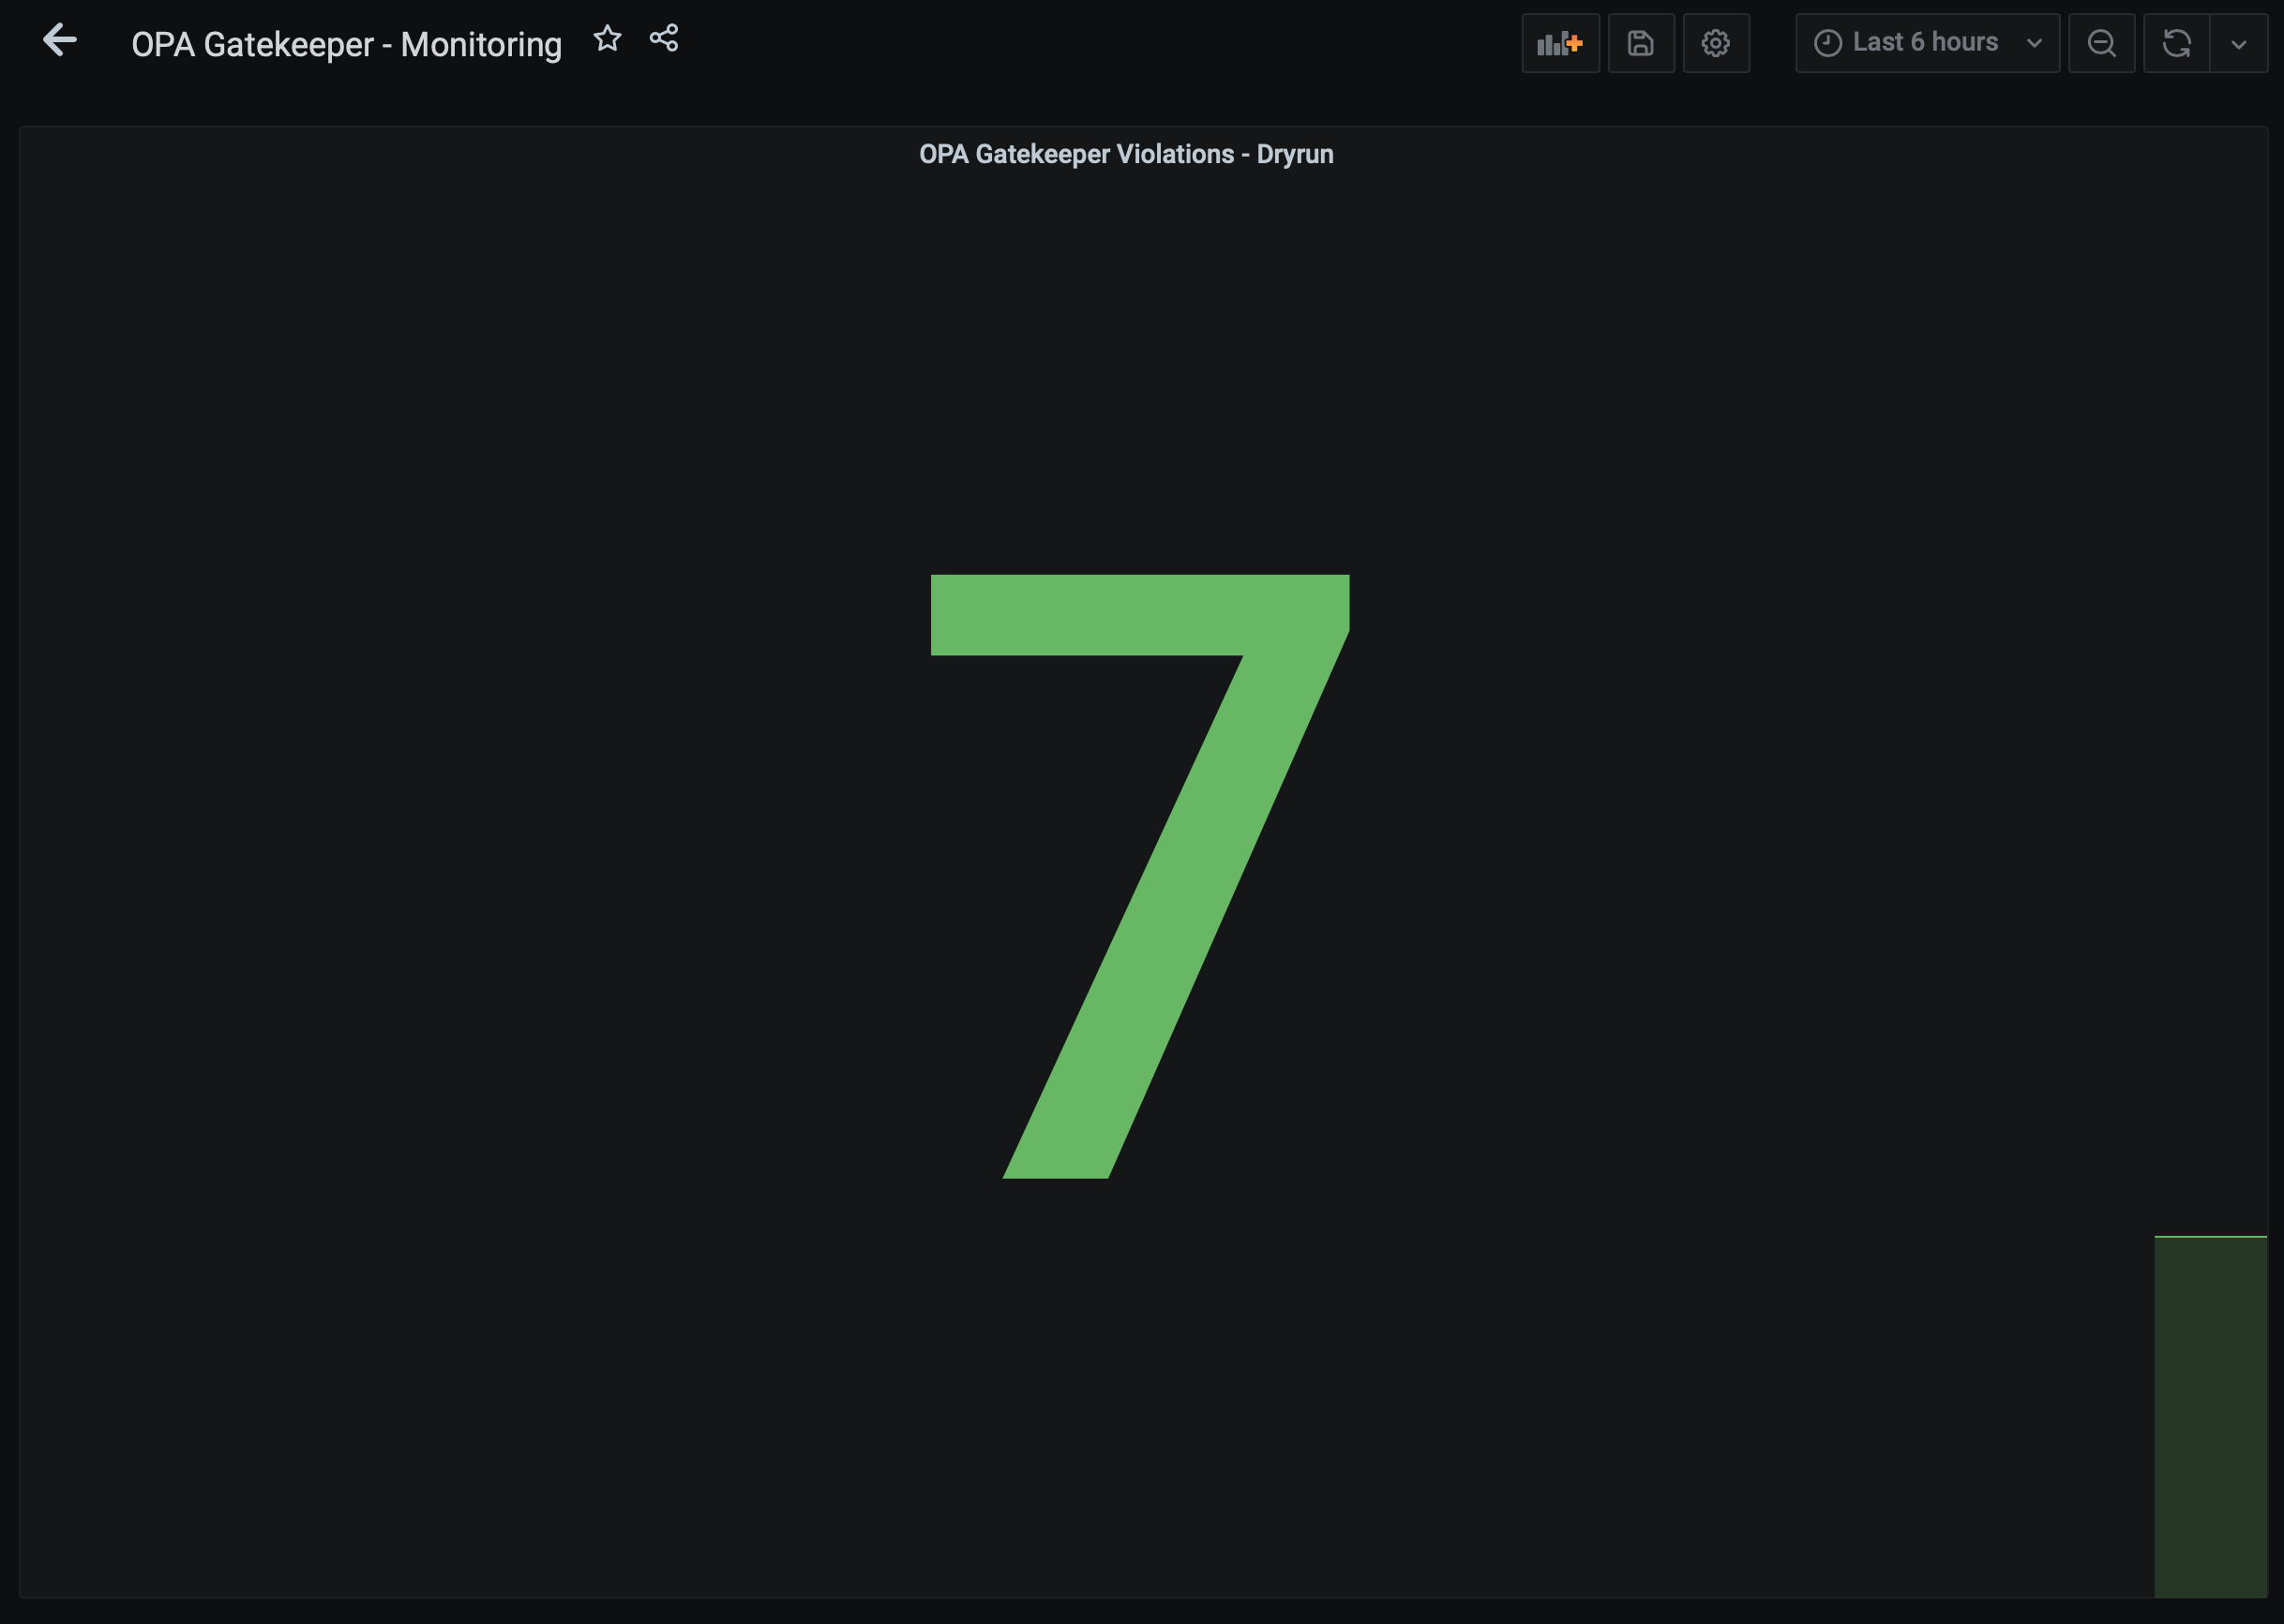
Now, we can create a new Kubernetes dashboard from Grafana and add a metric to display only the gatekeeper violations for our dry-run policies:
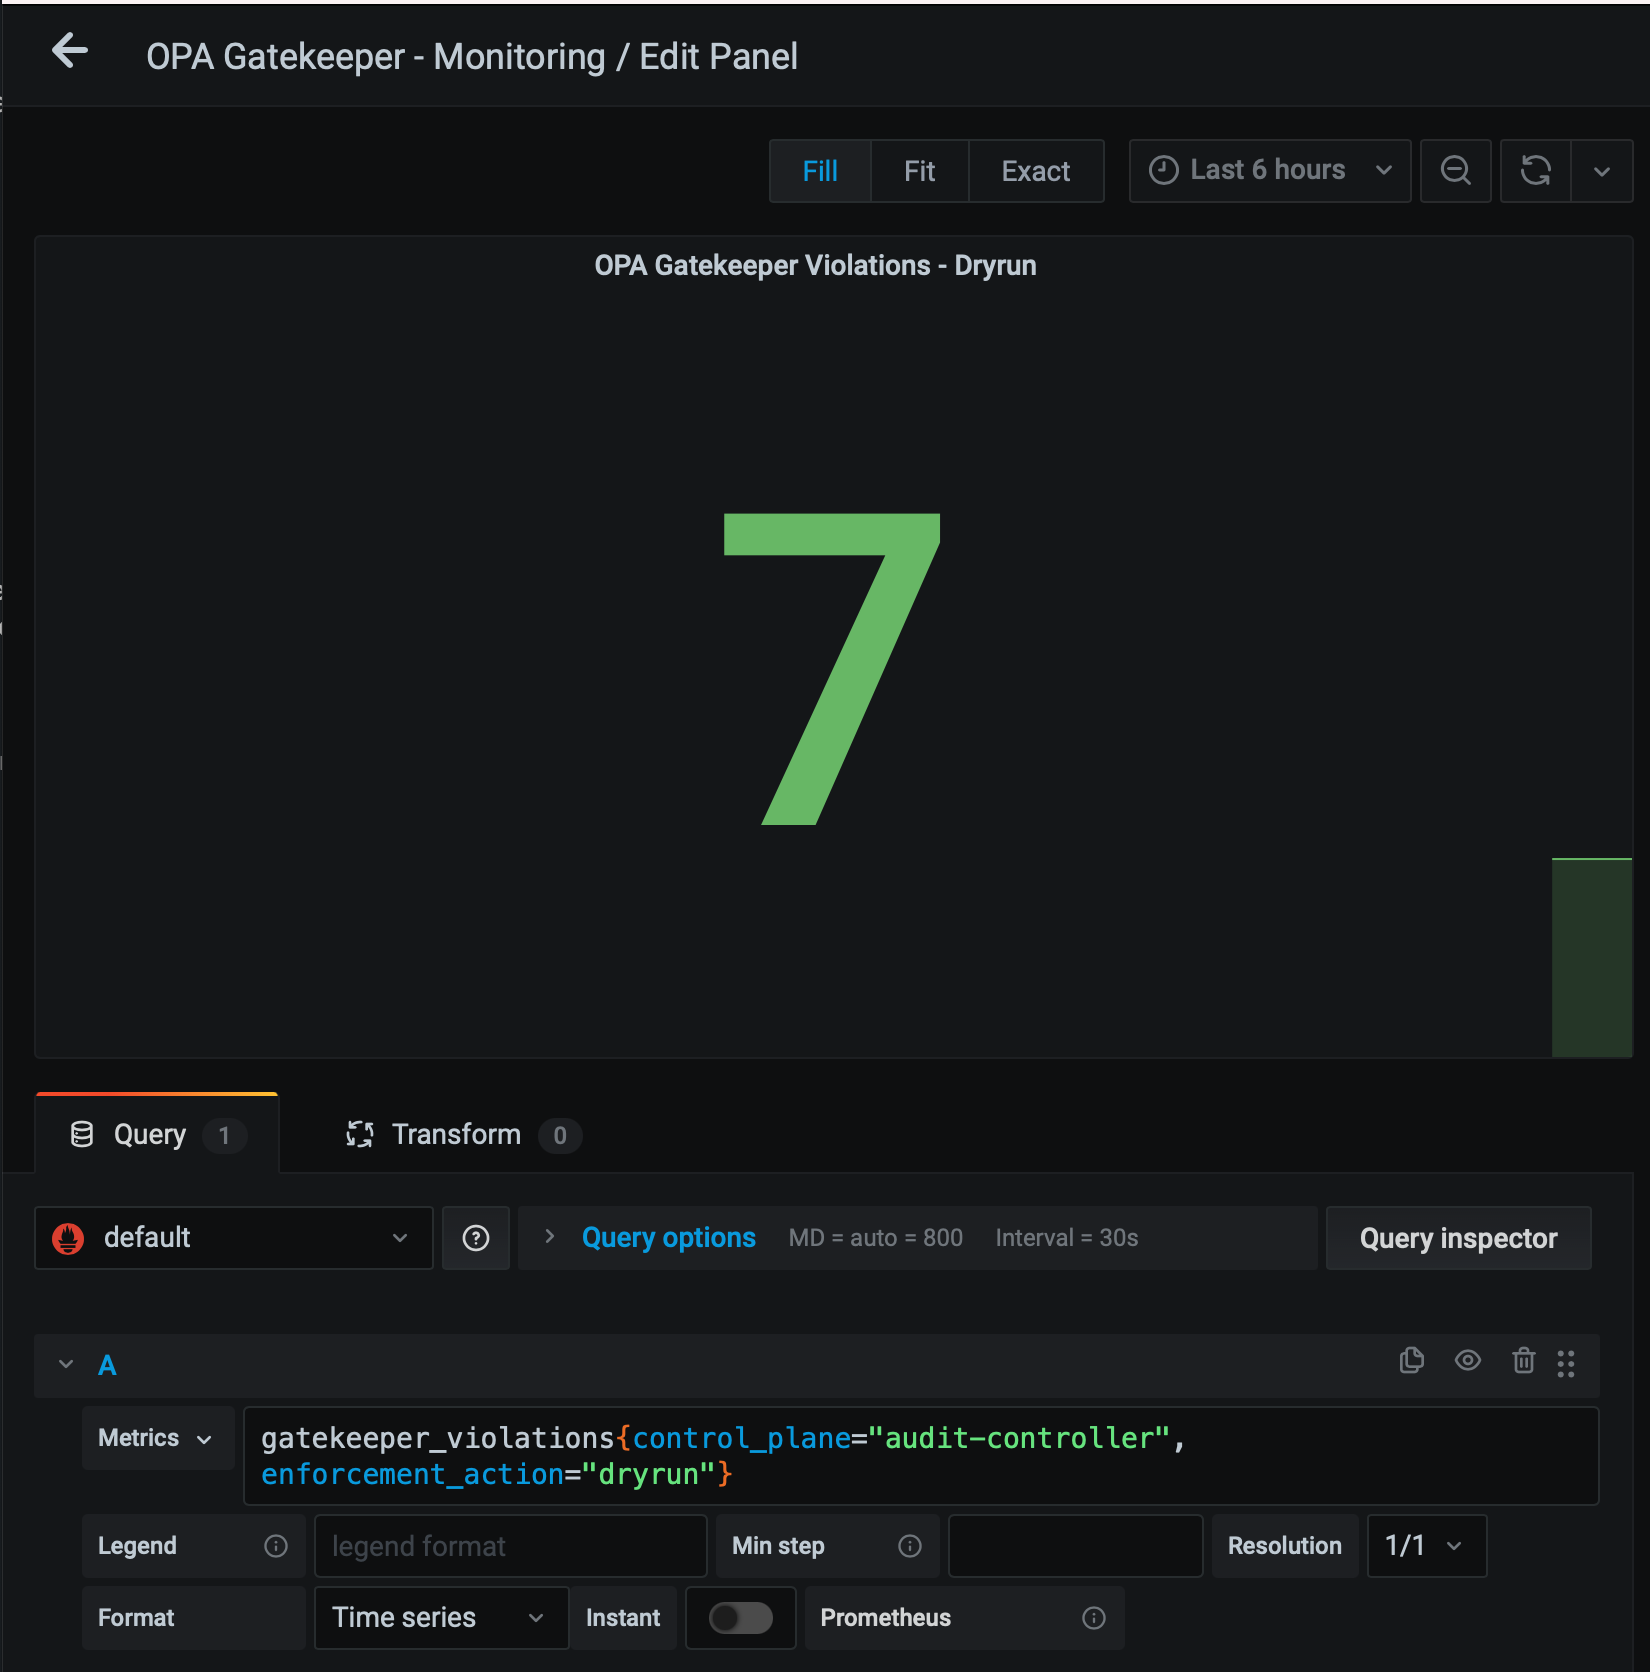
Metrics: gatekeeper_violations{control_plane="audit-controller", enforcement_action="dryrun"}
In conclusion, we saw how you can configure Prometheus and Grafana to monitor the number of OPA gatekeeper violations. Do not hesitate to read the official documentation of OPA gatekeeper, other metrics are available to help you to monitor your OPA gatekeeper solution (Current number of known constraints, Number of observed constraint templates, …).
Maxime.